GitHub for Project Management
What are GitHub Projects?
Adaptable, flexible tool for planning and tracking work on GitHub
Spreadsheet, task-board, and roadmap integrated with issues and pull requests
Provide multiple views by filtering, sorting, grouping issues/PRs
Visualize work with configurable charts
Add custom fields to track team-specific metadata
Why use GitHub for project management?
Issues and projects stoke collaboration
Issues act as short-term to-do lists
Projects capture longer-term goals and organize short-term issues
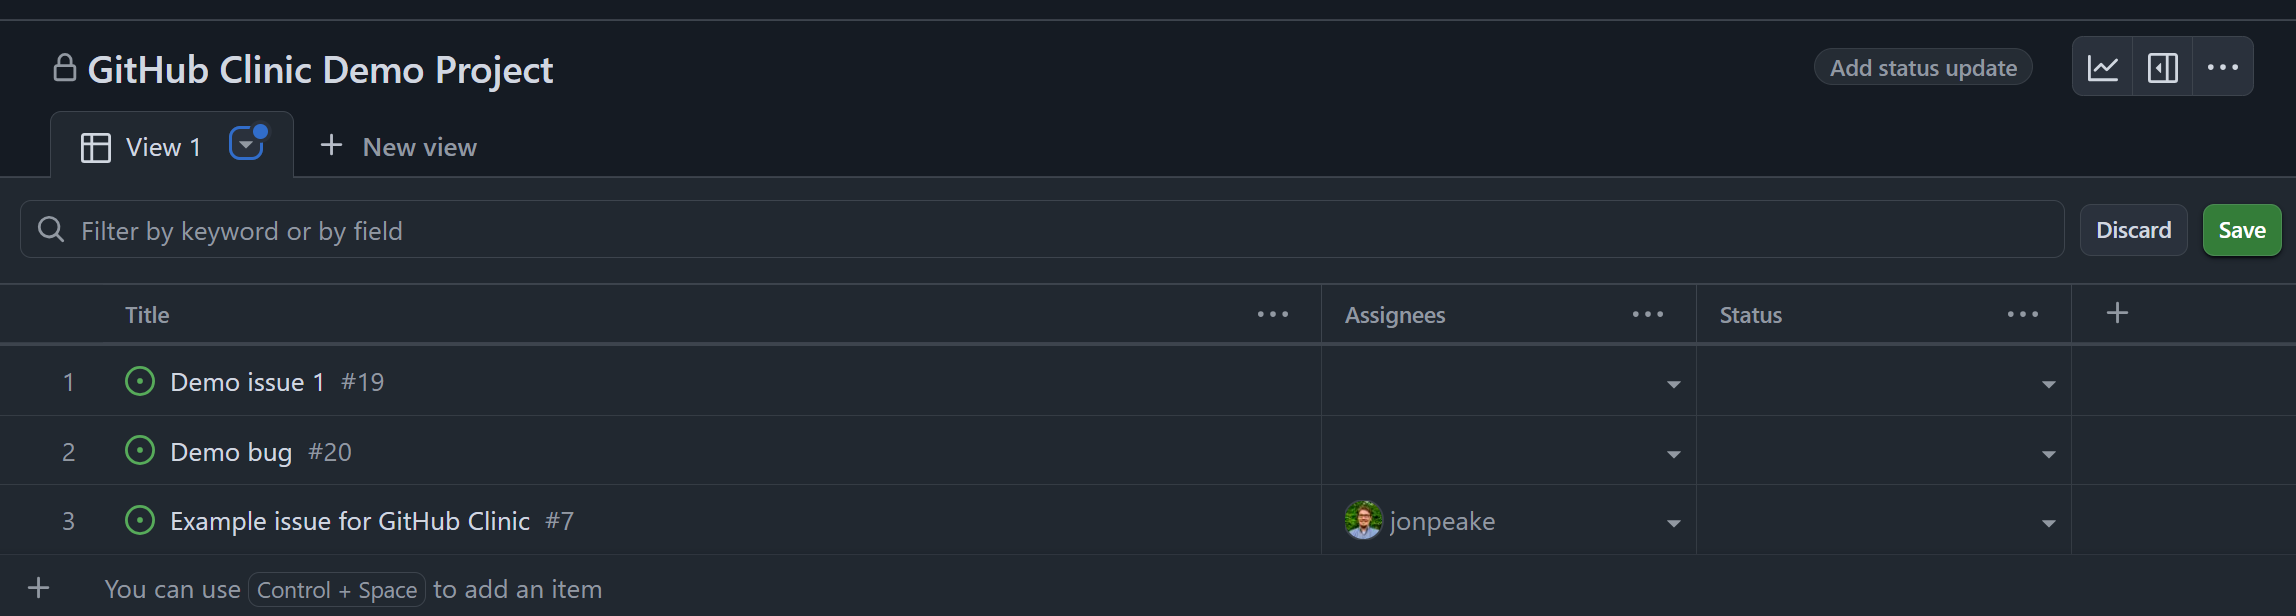
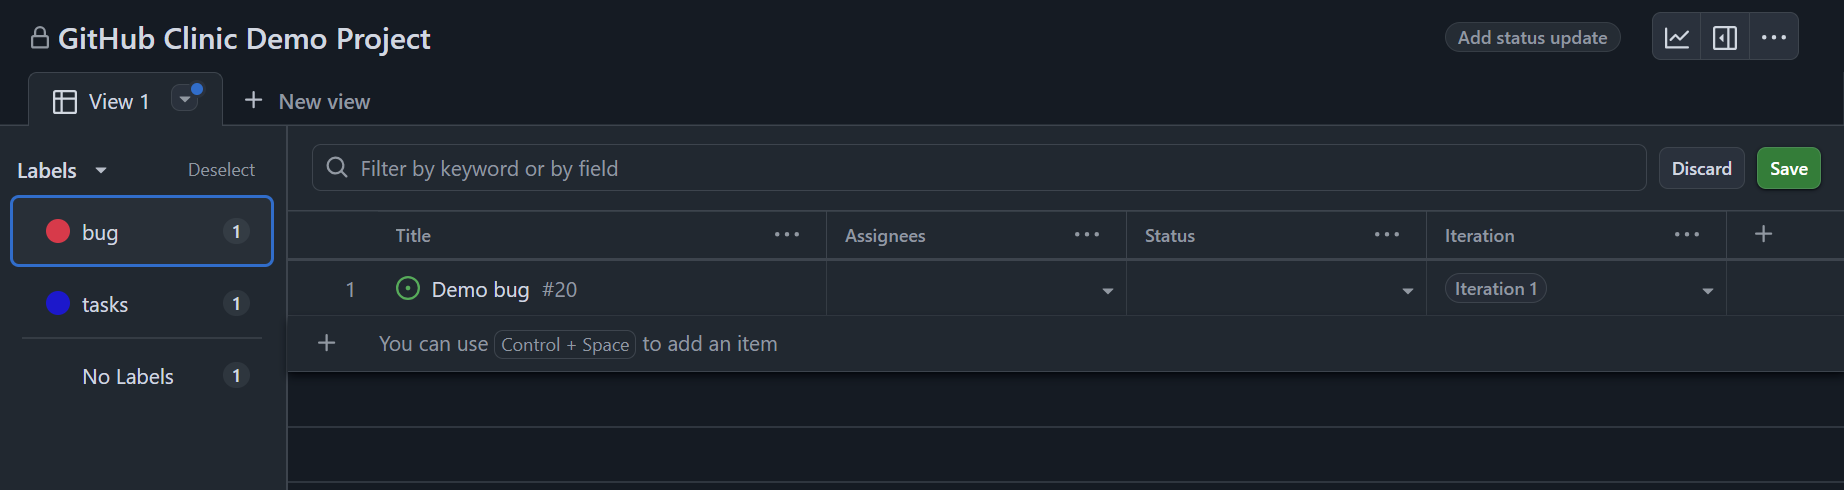
Project views
Table layout - Excel-style spreadsheet of project issues and metadata
![]()
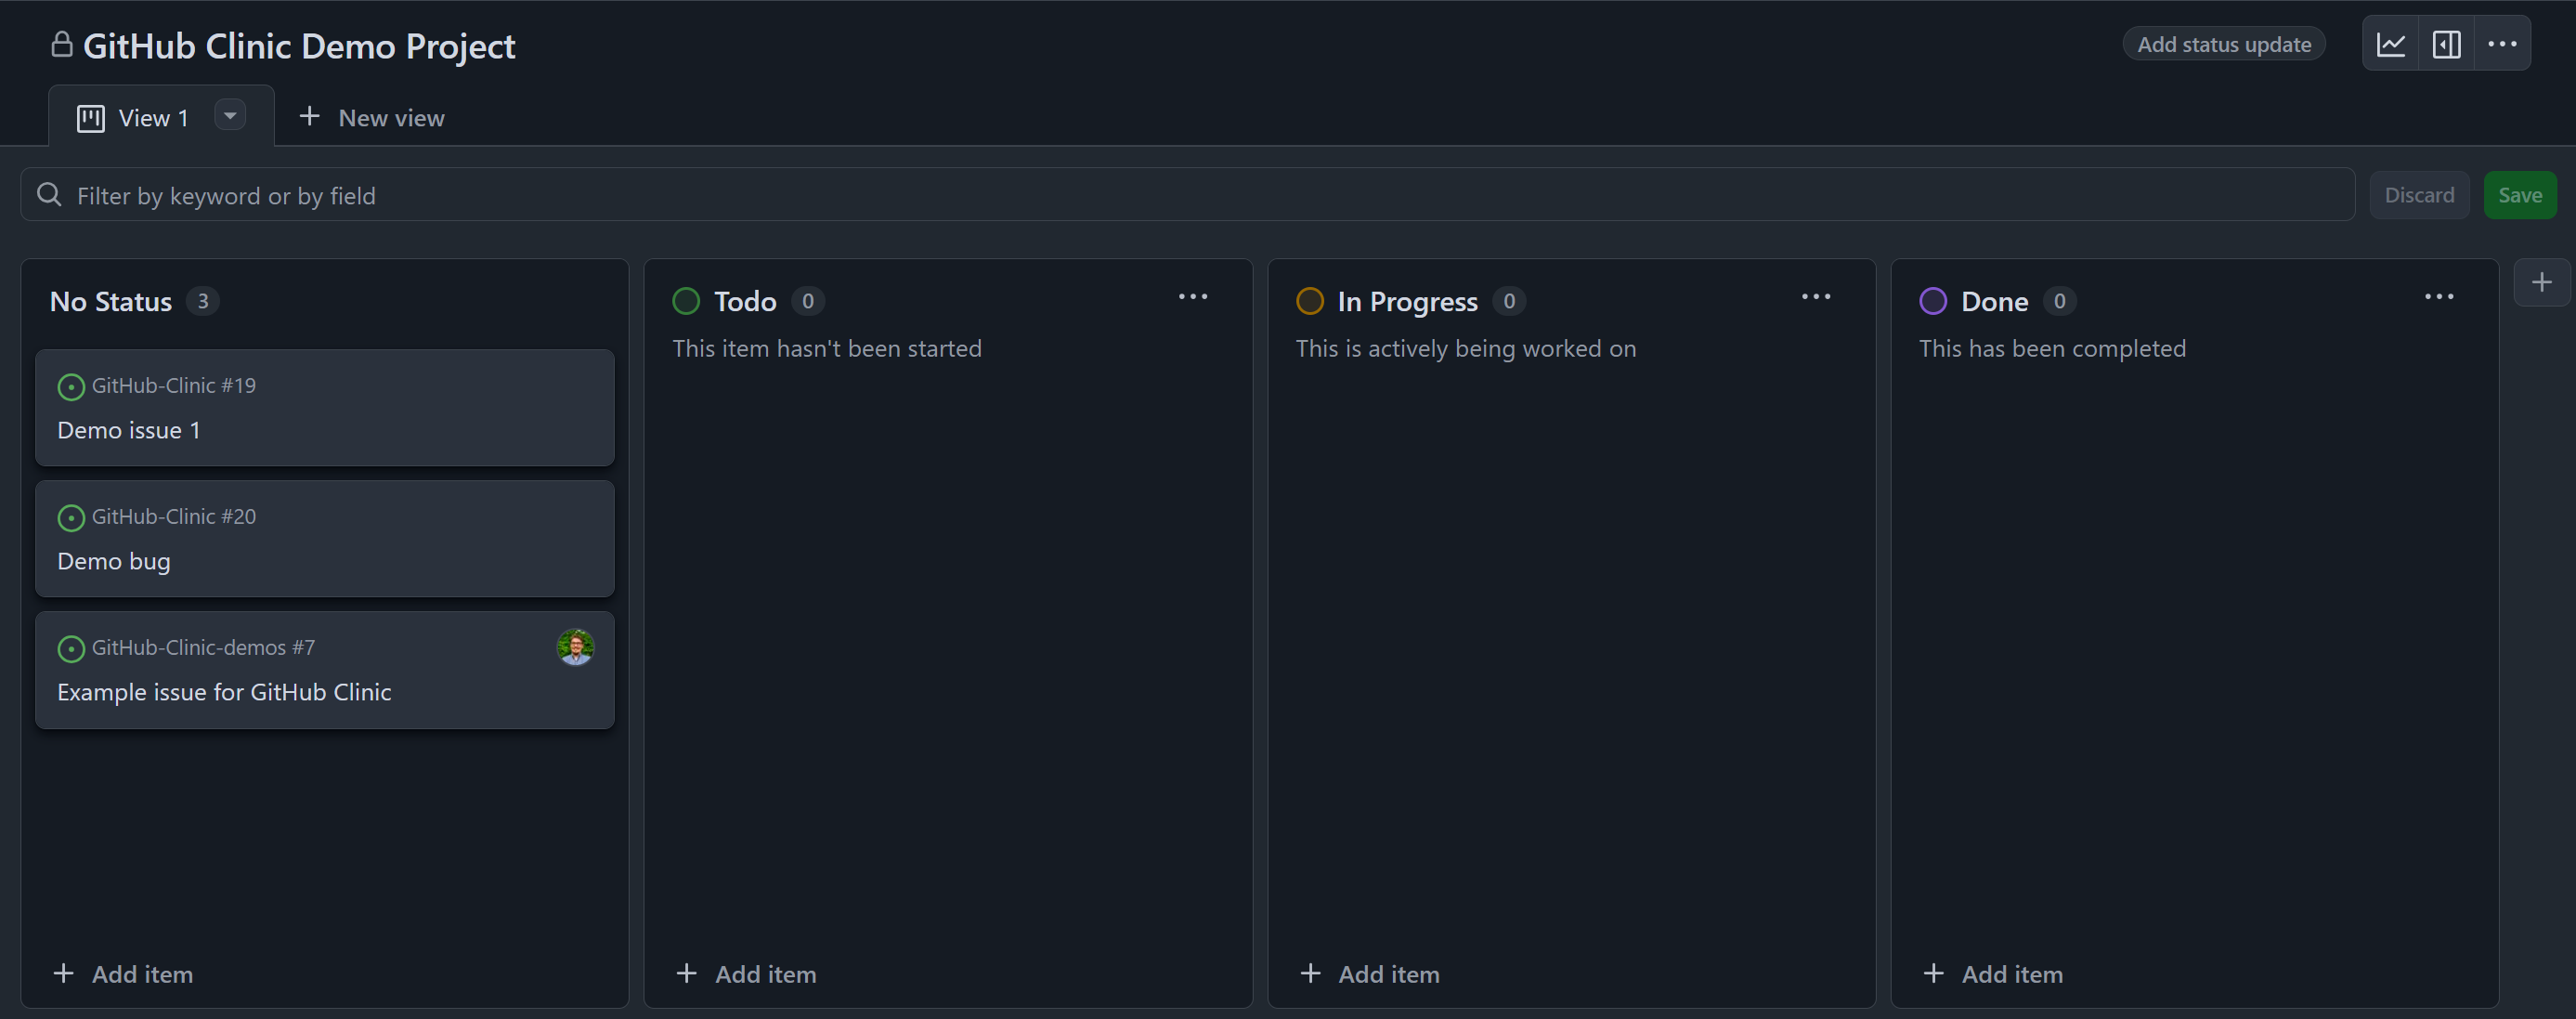
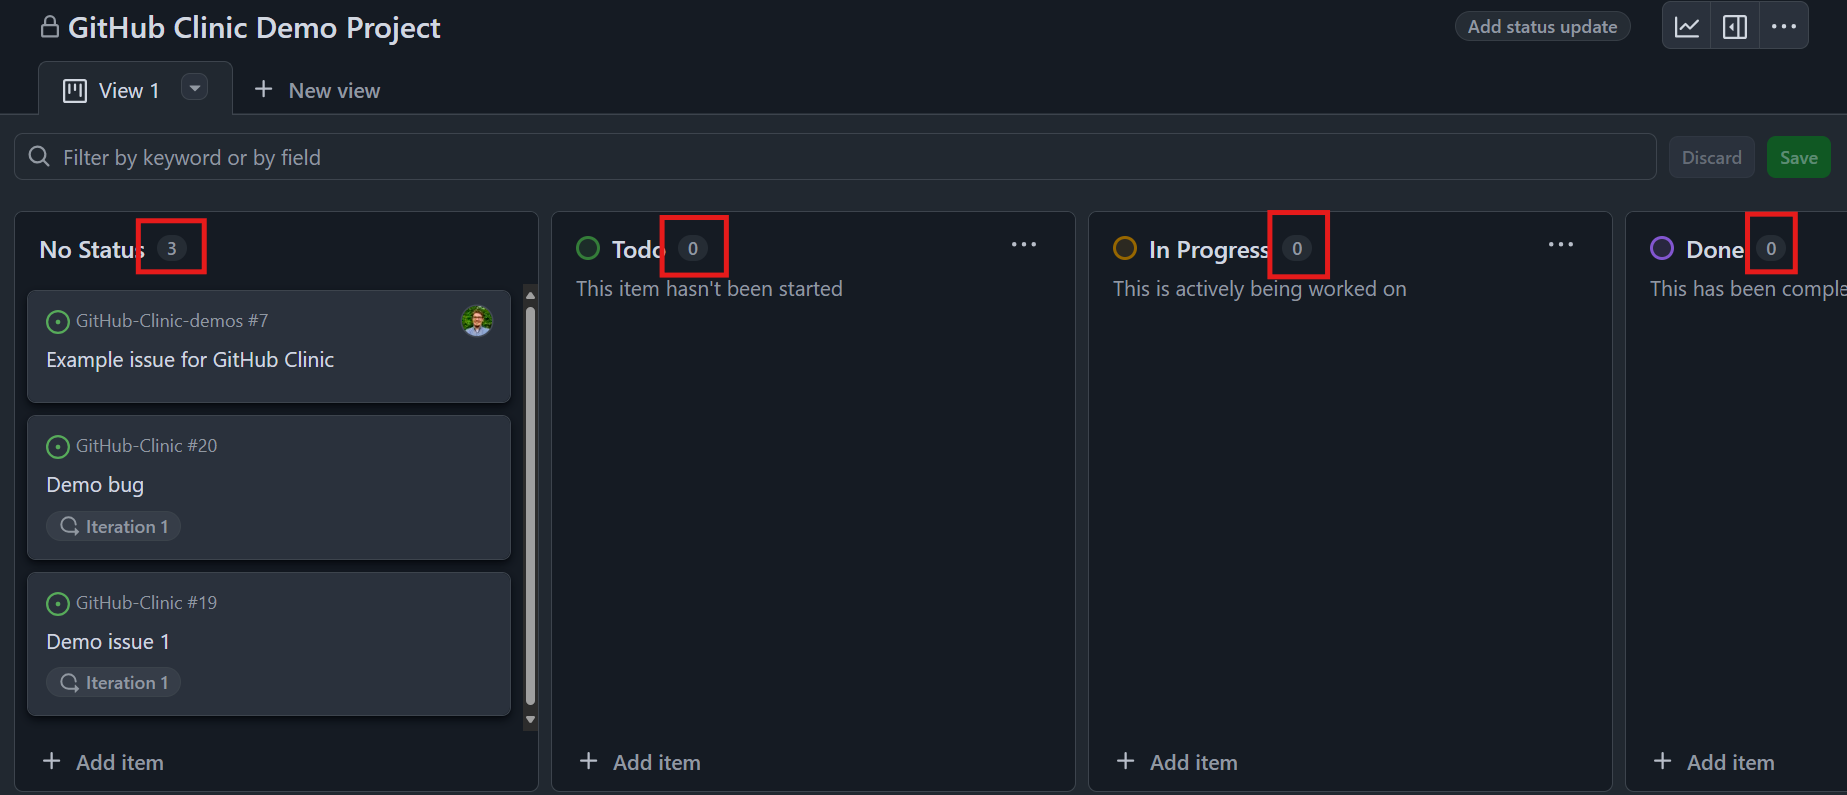
Project views
Board layout - Kanban-style board for organizing issues by status or label
![]()
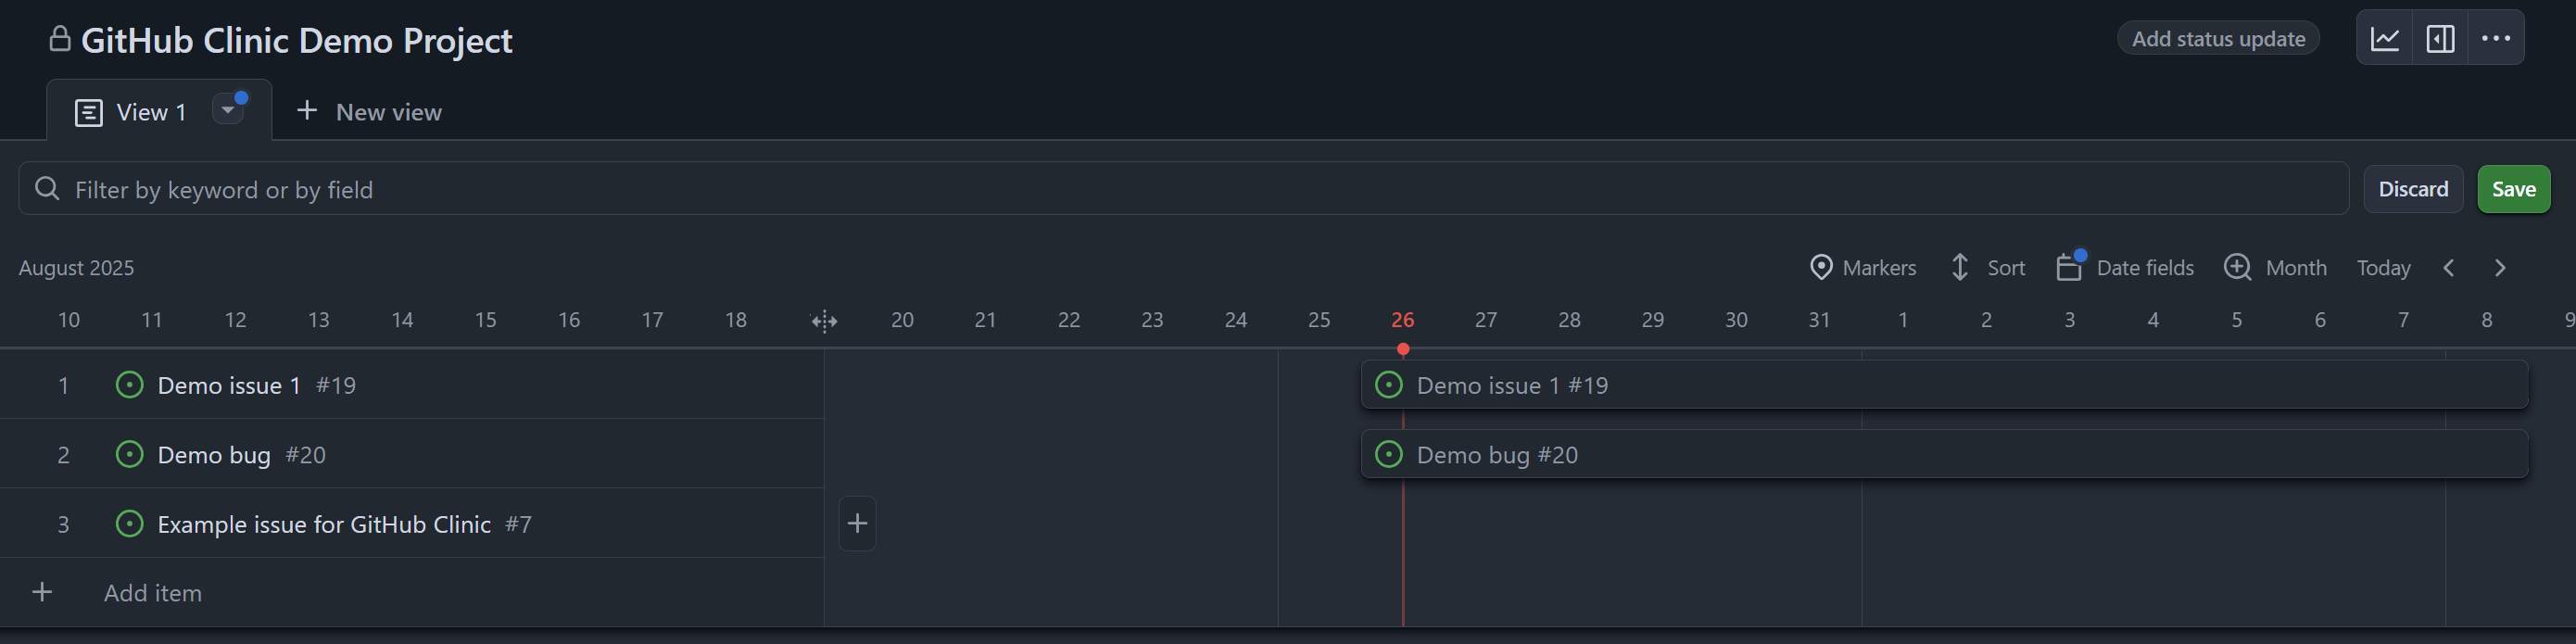
Project views
Roadmap layout- High-level visualization of project over time
![]()
Customizing Project Views
Fields (Table and Board layouts)
Based on issue metadata
In Table view, these add columns to the table to let you view, sort, and filter
In Board view, these are shown on each board item
Fully customizable
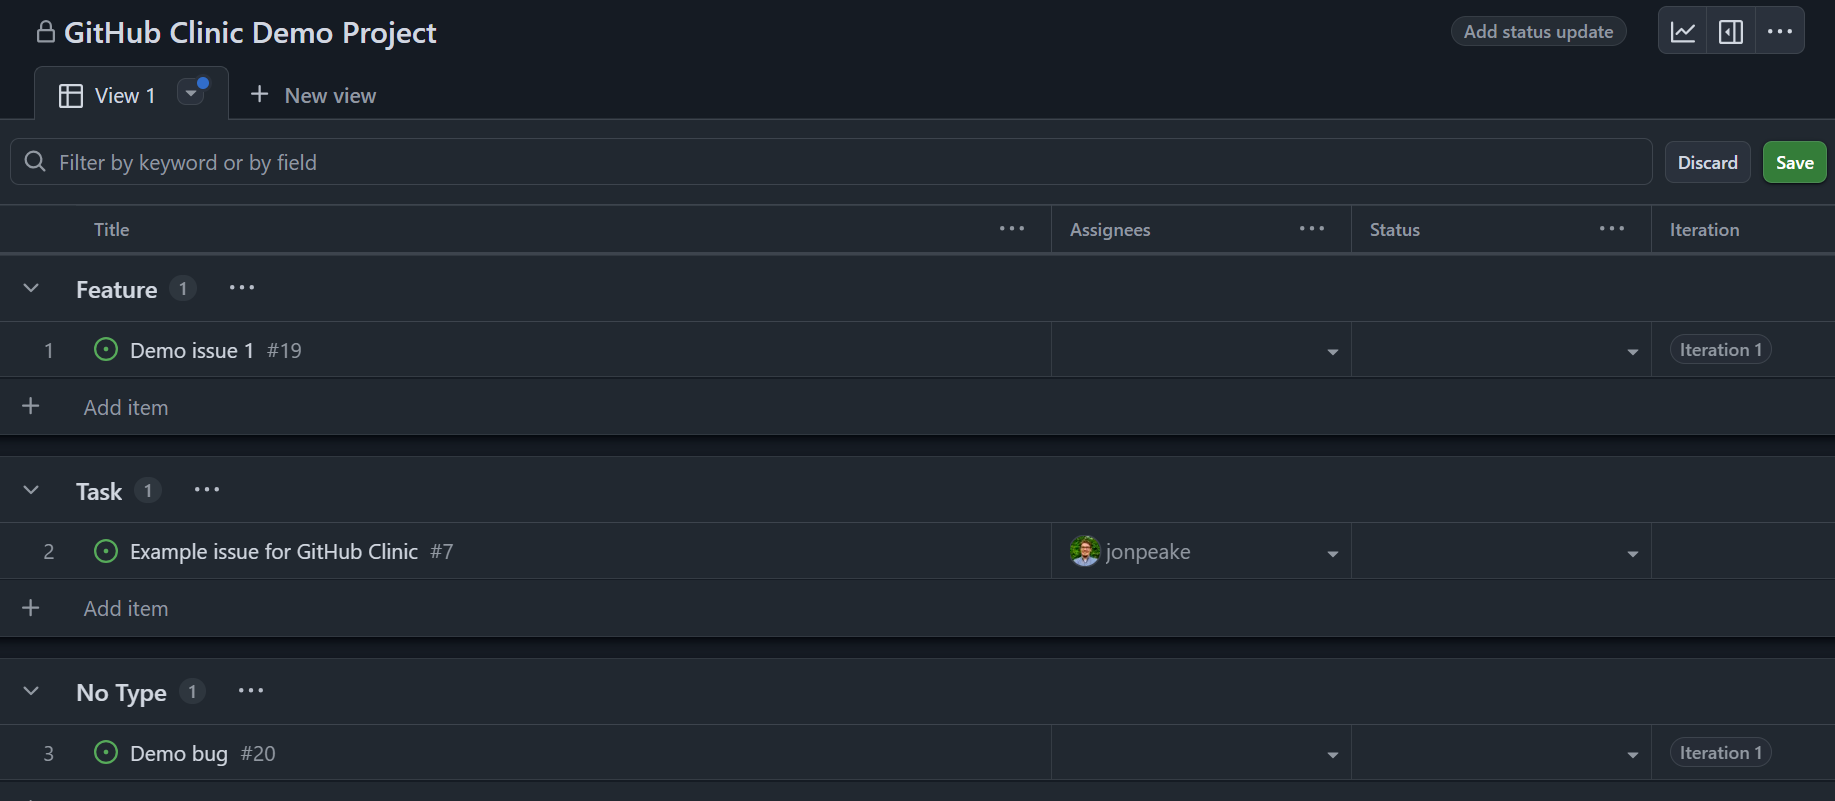
Grouping (All layouts)
- Horizontally split issues by certain aspects of an issue (metadata)
![]()
Sorting (All layouts)
Sort project issues by issue metadata
Multi-field sorting available
Can sort ascending or descending
Can manually sort by dragging and dropping issues
Slicing (All layouts)
![]()
Field sum (Board layout only)
- Add a count of the number of issues in each section of the board
![]()
Roadmap features
Date fields
Vertical markers
- Adds a vertical marker to show iterations, dates, and milestones
Zoom level
- Change density and zoom level of roadmap: month, quarter, and year
Filters
Add field-based filters to further customize views
Can be used for very specific purposes and are saved with each view
Combine filters across fields for hyper-specific filtering
Adding views
You can have multiple views in one project
Views can be tailored to many different needs through layouts, fields, and filters
Views can be temporary for a single session or saved to the project