📘 Learning Objectives
Show how to work with NASA OPeNDAP for PACE data
Create a NASA EDL session for authentication
Load single files with xarray.open_dataset
Load multiple files with xarray.open_mfdataset
Overview
The PACE Level-3 (gridded) OCI (ocean color instrument) data is available on an OPeNDAP server https://oceandata.sci.gsfc.nasa.gov/opendap/ . The full data are available on AWS via earthaccess.
NASA OPeNDAP servers (have nasa.gov in url) require Earthdata Login (EDL) authentication and some require an End User Licence Agreement (EULA). Here is the list of NASA OPeNDAP servers . There are Hyrax, GraDS and THREDDS servers. They behave slightly differently so it is good to know which one you are using.
Prerequisites
You need to have an EarthData Login username and password. Go here to get one https://urs.earthdata.nasa.gov/
I assume you have a .netrc file at ~ (home). ~/.netrc should look just like this with your username and password. Create that file if needed. You don’t need to create it if you don’t have this file. The earthaccess.login(persist=True) line will ask for your username and password and create the .netrc file for you.
machine urs.earthdata.nasa.gov
        login yourusername
        password yourpassword
Packages
import xarray as xrimport pydap.client
Create a NASA EDL authenticated session
Authenticate with earthaccess.login() then create the session which will create the right headers when we (or pydap) does requests.
import earthaccess= True )= earthaccess.get_requests_https_session()
PACE OPeNDAP server
Let’s go to this oceancolor OPeNDAP server https://oceandata.sci.gsfc.nasa.gov/opendap/ . It is Hyrax, which we can see in the footer. These have both DAP4 and DAP2 protocols. With pydap, you can specify protocol="dap4" so it knows which one to use. But xarray.open_dataset() doesn’t accept the protocol argument so we need to use a work around.
We dig into the directory to find the PACE-OCI data and then look at the L3SMI directory: https://oceandata.sci.gsfc.nasa.gov/opendap/PACE_OCI/L3SMI/2024/0301/contents.html
We will navigate to the PACE_OCI.20240301_20240331.L3m.MO.AVW.V3_0.avw.0p1deg.nc file in 2024/0301. Here is the url which you will see when you click on the file and get to the “OPeNDAP DAP4 Data Request Form”. This a monthly average.
url="http://oceandata.sci.gsfc.nasa.gov/opendap/PACE_OCI/L3SMI/2024/0301/PACE_OCI.20240301_20240331.L3m.MO.AVW.V3_0.avw.0p1deg.nc"
Silence the DAP2 warning
Using http (or https) will open with with dap4 and pydap which we are using to help with authentication will complain. We could replace http with dap4 to use DAP4 but the variables would be garbled a bit; it is a bug with the DAP4.
dap4_url = url.replace("http", "dap4", 1)Instead I will silence the DAP2 warning. It works just fine.
import warnings"ignore" ,= "PyDAP was unable to determine the DAP protocol defaulting to DAP2.*" ,= UserWarning ,= "pydap.handlers.dap"
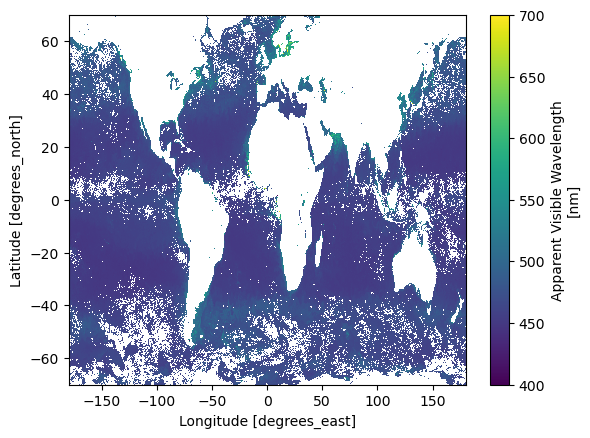
Apparent Visible Wavelength (AVW)
AVW is not a derived geophysical variable, but instead an objective descriptor of the ocean’s color. This is a useful monitoring tool to assess if there are any changes to the color of the water, and if so, what direction the color is shifting (i.e. more red or more blue). It serves as an early indicator to detect changes in the optical water properties.
= "http://oceandata.sci.gsfc.nasa.gov/opendap/PACE_OCI/L3SMI/2024/0301/PACE_OCI.20240301_20240331.L3m.MO.AVW.V3_0.avw.0p1deg.nc" = xr.open_dataset(url, engine= "pydap" , session= edl_session)
<xarray.Dataset> Size: 26MB
Dimensions:  (lat: 1800, lon: 3600, rgb: 3, eightbitcolor: 256)
Coordinates:
  * lat      (lat) float32 7kB 89.95 89.85 89.75 89.65 ... -89.75 -89.85 -89.95
  * lon      (lon) float32 14kB -179.9 -179.9 -179.8 ... 179.8 179.9 180.0
Dimensions without coordinates: rgb, eightbitcolor
Data variables:
    avw      (lat, lon) float32 26MB ...
    palette  (rgb, eightbitcolor) uint8 768B ...
Attributes: (12/62)
    product_name:                      PACE_OCI.20240301_20240331.L3m.MO.AVW....
    instrument:                        OCI
    title:                             OCI Level-3 Standard Mapped Image
    project:                           Ocean Biology Processing Group (NASA/G...
    platform:                          PACE
    source:                            satellite observations from OCI-PACE
    ...                                ...
    cdm_data_type:                     grid
    identifier_product_doi_authority:  http://dx.doi.org
    identifier_product_doi:            10.5067/PACE/OCI/L3M/AVW/3.0
    data_bins:                         Attribute elided: Unsupported attribut...
    data_minimum:                      399.999969
data_maximum: 700.000061 Dimensions: lat : 1800lon : 3600rgb : 3eightbitcolor : 256
Coordinates: (2)
Data variables: (2)
avw
(lat, lon)
float32
...
long_name : Apparent Visible Wavelength units : nm valid_min : 400.0 valid_max : 700.0 reference : Vandermeulen, R. A., Mannino, A., Craig, S.E., Werdell, P.J., 2020: 150 shades of green: Using the full spectrum of remote sensing reflectance to elucidate color shifts in the ocean, Remote Sensing of Environment, 247, 111900, https://doi.org/10.1016/j.rse.2020.111900, https://doi.org/10.5067/KAROCHG01RYJ display_scale : linear display_min : 450.0 display_max : 575.0 [6480000 values with dtype=float32] palette
(rgb, eightbitcolor)
uint8
...
[768 values with dtype=uint8] Indexes: (2)
PandasIndex
PandasIndex(Index([ 89.94999694824219,   89.8499984741211,              89.75,
         89.6500015258789,  89.55000305175781,  89.44999694824219,
         89.3499984741211,              89.25,   89.1500015258789,
        89.05000305175781,
       ...
       -89.05000305175781,  -89.1500015258789,             -89.25,
       -89.35000610351562, -89.45000457763672, -89.55000305175781,
        -89.6500015258789,             -89.75, -89.85000610351562,
       -89.95000457763672],
dtype='float32', name='lat', length=1800)) PandasIndex
PandasIndex(Index([ -179.9499969482422, -179.85000610351562,             -179.75,
       -179.64999389648438,  -179.5500030517578,  -179.4499969482422,
       -179.35000610351562,             -179.25, -179.14999389648438,
        -179.0500030517578,
       ...
         179.0500030517578,  179.15000915527344,              179.25,
        179.35000610351562,  179.45001220703125,   179.5500030517578,
        179.65000915527344,              179.75,  179.85000610351562,
        179.95001220703125],
      dtype='float32', name='lon', length=3600))
Attributes: (62)
product_name : PACE_OCI.20240301_20240331.L3m.MO.AVW.V3_0.avw.0p1deg.nc instrument : OCI title : OCI Level-3 Standard Mapped Image project : Ocean Biology Processing Group (NASA/GSFC/OBPG) platform : PACE source : satellite observations from OCI-PACE temporal_range : 27-day processing_version : 3.0 date_created : 2025-03-06T17:06:41.000Z history : l3mapgen par=PACE_OCI.20240301_20240331.L3m.MO.AVW.V3_0.avw.0p1deg.nc.param l2_flag_names : ATMFAIL,LAND,HILT,HISATZEN,STRAYLIGHT,CLDICE,COCCOLITH,LOWLW,CHLWARN,CHLFAIL,NAVWARN,MAXAERITER,HISOLZEN,NAVFAIL,FILTER,HIGLINT time_coverage_start : 2024-03-05T00:08:58.000Z time_coverage_end : 2024-04-01T02:24:44.000Z start_orbit_number : 0 end_orbit_number : 0 map_projection : Equidistant Cylindrical latitude_units : degrees_north longitude_units : degrees_east northernmost_latitude : 90.0 southernmost_latitude : -90.0 westernmost_longitude : -180.0 easternmost_longitude : 180.0 geospatial_lat_max : 90.0 geospatial_lat_min : -90.0 geospatial_lon_max : 180.0 geospatial_lon_min : -180.0 latitude_step : 0.100000001 longitude_step : 0.100000001 sw_point_latitude : -89.9499969 sw_point_longitude : -179.949997 spatialResolution : 11.131949 km geospatial_lon_resolution : 11.131949 km geospatial_lat_resolution : 11.131949 km geospatial_lat_units : degrees_north geospatial_lon_units : degrees_east number_of_lines : 1800 number_of_columns : 3600 measure : Mean suggested_image_scaling_minimum : 450.0 suggested_image_scaling_maximum : 575.0 suggested_image_scaling_type : LINEAR suggested_image_scaling_applied : No _lastModified : 2025-03-06T17:06:41.000Z Conventions : CF-1.6 ACDD-1.3 institution : NASA Goddard Space Flight Center, Ocean Ecology Laboratory, Ocean Biology Processing Group standard_name_vocabulary : CF Standard Name Table v36 naming_authority : gov.nasa.gsfc.sci.oceandata id : 3.0/L3/PACE_OCI.20240301_20240331.L3b.MO.AVW.V3_0.nc license : https://science.nasa.gov/earth-science/earth-science-data/data-information-policy/ creator_name : NASA/GSFC/OBPG publisher_name : NASA/GSFC/OBPG creator_email : data@oceancolor.gsfc.nasa.gov publisher_email : data@oceancolor.gsfc.nasa.gov creator_url : https://oceandata.sci.gsfc.nasa.gov publisher_url : https://oceandata.sci.gsfc.nasa.gov processing_level : L3 Mapped cdm_data_type : grid identifier_product_doi_authority : http://dx.doi.org identifier_product_doi : 10.5067/PACE/OCI/L3M/AVW/3.0 data_bins : Attribute elided: Unsupported attribute type (NC_INT64) data_minimum : 399.999969 data_maximum : 700.000061
We can plot. Notice the order of the latitude. It goes from positive to negative.
"avw" ].sel(lat = slice (70 , - 70 )).plot();
Opening multiple files
Let’s combine 3 months.
= "http://oceandata.sci.gsfc.nasa.gov/opendap/PACE_OCI/L3SMI/2024/0301/PACE_OCI.20240301_20240331.L3m.MO.AVW.V3_0.avw.0p1deg.nc" = "http://oceandata.sci.gsfc.nasa.gov/opendap/PACE_OCI/L3SMI/2024/0401/PACE_OCI.20240401_20240430.L3m.MO.AVW.V3_0.avw.0p1deg.nc" = "http://oceandata.sci.gsfc.nasa.gov/opendap/PACE_OCI/L3SMI/2024/0501/PACE_OCI.20240501_20240531.L3m.MO.AVW.V3_0.avw.0p1deg.nc" = [mar, apr, may]
= xr.open_mfdataset(= "pydap" ,= 'nested' , concat_dim= "time" , = edl_session)
<xarray.Dataset> Size: 78MB
Dimensions:  (time: 3, lat: 1800, lon: 3600, rgb: 3, eightbitcolor: 256)
Coordinates:
  * lat      (lat) float32 7kB 89.95 89.85 89.75 89.65 ... -89.75 -89.85 -89.95
  * lon      (lon) float32 14kB -179.9 -179.9 -179.8 ... 179.8 179.9 180.0
Dimensions without coordinates: time, rgb, eightbitcolor
Data variables:
    avw      (time, lat, lon) float32 78MB dask.array<chunksize=(1, 1800, 3600), meta=np.ndarray>
    palette  (time, rgb, eightbitcolor) uint8 2kB dask.array<chunksize=(1, 3, 256), meta=np.ndarray>
Attributes: (12/62)
    product_name:                      PACE_OCI.20240301_20240331.L3m.MO.AVW....
    instrument:                        OCI
    title:                             OCI Level-3 Standard Mapped Image
    project:                           Ocean Biology Processing Group (NASA/G...
    platform:                          PACE
    source:                            satellite observations from OCI-PACE
    ...                                ...
    cdm_data_type:                     grid
    identifier_product_doi_authority:  http://dx.doi.org
    identifier_product_doi:            10.5067/PACE/OCI/L3M/AVW/3.0
    data_bins:                         Attribute elided: Unsupported attribut...
    data_minimum:                      399.999969
data_maximum: 700.000061 Dimensions: time : 3lat : 1800lon : 3600rgb : 3eightbitcolor : 256
Coordinates: (2)
Data variables: (2)
avw
(time, lat, lon)
float32
dask.array<chunksize=(1, 1800, 3600), meta=np.ndarray>
long_name : Apparent Visible Wavelength units : nm valid_min : 400.0 valid_max : 700.0 reference : Vandermeulen, R. A., Mannino, A., Craig, S.E., Werdell, P.J., 2020: 150 shades of green: Using the full spectrum of remote sensing reflectance to elucidate color shifts in the ocean, Remote Sensing of Environment, 247, 111900, https://doi.org/10.1016/j.rse.2020.111900, https://doi.org/10.5067/KAROCHG01RYJ display_scale : linear display_min : 450.0 display_max : 575.0
Bytes
74.16 MiB
24.72 MiB
Shape
(3, 1800, 3600)
(1, 1800, 3600)
Dask graph
3 chunks in 10 graph layers
Data type
float32 numpy.ndarray
3600 1800 3
palette
(time, rgb, eightbitcolor)
uint8
dask.array<chunksize=(1, 3, 256), meta=np.ndarray>
Bytes
2.25 kiB
768 B
Shape
(3, 3, 256)
(1, 3, 256)
Dask graph
3 chunks in 10 graph layers
Data type
uint8 numpy.ndarray
256 3 3
Indexes: (2)
PandasIndex
PandasIndex(Index([ 89.94999694824219,   89.8499984741211,              89.75,
         89.6500015258789,  89.55000305175781,  89.44999694824219,
         89.3499984741211,              89.25,   89.1500015258789,
        89.05000305175781,
       ...
       -89.05000305175781,  -89.1500015258789,             -89.25,
       -89.35000610351562, -89.45000457763672, -89.55000305175781,
        -89.6500015258789,             -89.75, -89.85000610351562,
       -89.95000457763672],
dtype='float32', name='lat', length=1800)) PandasIndex
PandasIndex(Index([ -179.9499969482422, -179.85000610351562,             -179.75,
       -179.64999389648438,  -179.5500030517578,  -179.4499969482422,
       -179.35000610351562,             -179.25, -179.14999389648438,
        -179.0500030517578,
       ...
         179.0500030517578,  179.15000915527344,              179.25,
        179.35000610351562,  179.45001220703125,   179.5500030517578,
        179.65000915527344,              179.75,  179.85000610351562,
        179.95001220703125],
      dtype='float32', name='lon', length=3600))
Attributes: (62)
product_name : PACE_OCI.20240301_20240331.L3m.MO.AVW.V3_0.avw.0p1deg.nc instrument : OCI title : OCI Level-3 Standard Mapped Image project : Ocean Biology Processing Group (NASA/GSFC/OBPG) platform : PACE source : satellite observations from OCI-PACE temporal_range : 27-day processing_version : 3.0 date_created : 2025-03-06T17:06:41.000Z history : l3mapgen par=PACE_OCI.20240301_20240331.L3m.MO.AVW.V3_0.avw.0p1deg.nc.param l2_flag_names : ATMFAIL,LAND,HILT,HISATZEN,STRAYLIGHT,CLDICE,COCCOLITH,LOWLW,CHLWARN,CHLFAIL,NAVWARN,MAXAERITER,HISOLZEN,NAVFAIL,FILTER,HIGLINT time_coverage_start : 2024-03-05T00:08:58.000Z time_coverage_end : 2024-04-01T02:24:44.000Z start_orbit_number : 0 end_orbit_number : 0 map_projection : Equidistant Cylindrical latitude_units : degrees_north longitude_units : degrees_east northernmost_latitude : 90.0 southernmost_latitude : -90.0 westernmost_longitude : -180.0 easternmost_longitude : 180.0 geospatial_lat_max : 90.0 geospatial_lat_min : -90.0 geospatial_lon_max : 180.0 geospatial_lon_min : -180.0 latitude_step : 0.100000001 longitude_step : 0.100000001 sw_point_latitude : -89.9499969 sw_point_longitude : -179.949997 spatialResolution : 11.131949 km geospatial_lon_resolution : 11.131949 km geospatial_lat_resolution : 11.131949 km geospatial_lat_units : degrees_north geospatial_lon_units : degrees_east number_of_lines : 1800 number_of_columns : 3600 measure : Mean suggested_image_scaling_minimum : 450.0 suggested_image_scaling_maximum : 575.0 suggested_image_scaling_type : LINEAR suggested_image_scaling_applied : No _lastModified : 2025-03-06T17:06:41.000Z Conventions : CF-1.6 ACDD-1.3 institution : NASA Goddard Space Flight Center, Ocean Ecology Laboratory, Ocean Biology Processing Group standard_name_vocabulary : CF Standard Name Table v36 naming_authority : gov.nasa.gsfc.sci.oceandata id : 3.0/L3/PACE_OCI.20240301_20240331.L3b.MO.AVW.V3_0.nc license : https://science.nasa.gov/earth-science/earth-science-data/data-information-policy/ creator_name : NASA/GSFC/OBPG publisher_name : NASA/GSFC/OBPG creator_email : data@oceancolor.gsfc.nasa.gov publisher_email : data@oceancolor.gsfc.nasa.gov creator_url : https://oceandata.sci.gsfc.nasa.gov publisher_url : https://oceandata.sci.gsfc.nasa.gov processing_level : L3 Mapped cdm_data_type : grid identifier_product_doi_authority : http://dx.doi.org identifier_product_doi : 10.5067/PACE/OCI/L3M/AVW/3.0 data_bins : Attribute elided: Unsupported attribute type (NC_INT64) data_minimum : 399.999969 data_maximum : 700.000061
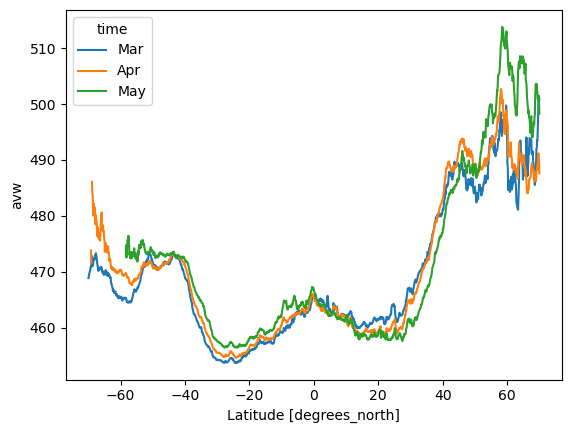
Plot mean AVW over all longitudes (global) by latitude and month
= ds["avw" ].sel(lat = slice (70 , - 70 )).mean(dim= ["lon" ])
# Define custom labels for each time step = ["Mar" , "Apr" , "May" ] # Adjust based on actual time steps # Assign new labels to the time coordinate = lat_mean.assign_coords({"time" : custom_time_labels})# Plot = "lat" );
Spectral phytoplankton absorption coefficients (aph)
We are going to get 4km data on Jan 1, 2025. This is rather massive (27 Gb) so we definitely want to subset before downloading.
We will get the plot at the Newport Line https://www.st.nmfs.noaa.gov/copepod/time-series/us-50501/ : Latitude: 44.6517 Longitude: -124.1770
import warnings"ignore" ,= "PyDAP was unable to determine the DAP protocol defaulting to DAP2.*" ,= UserWarning ,= "pydap.handlers.dap" import earthaccess= True )= earthaccess.get_requests_https_session()import xarray as xr= "http://oceandata.sci.gsfc.nasa.gov/opendap/PACE_OCI/L3SMI/2024/0801/PACE_OCI.20240801.L3m.DAY.IOP.V3_0.aph.4km.nc" = xr.open_dataset(url, engine= "pydap" , session= edl_session)
<xarray.Dataset> Size: 6GB
Dimensions:     (wavelength: 19, lat: 4320, lon: 8640, rgb: 3,
                 eightbitcolor: 256)
Coordinates:
  * wavelength  (wavelength) float64 152B 351.0 361.0 385.0 ... 678.0 711.0
  * lat         (lat) float32 17kB 89.98 89.94 89.9 ... -89.9 -89.94 -89.98
  * lon         (lon) float32 35kB -180.0 -179.9 -179.9 ... 179.9 179.9 180.0
Dimensions without coordinates: rgb, eightbitcolor
Data variables:
    aph         (lat, lon, wavelength) float64 6GB ...
    palette     (rgb, eightbitcolor) uint8 768B ...
Attributes: (12/64)
    product_name:                      PACE_OCI.20240801.L3m.DAY.IOP.V3_0.aph...
    instrument:                        OCI
    title:                             OCI Level-3 Standard Mapped Image
    project:                           Ocean Biology Processing Group (NASA/G...
    platform:                          PACE
    source:                            satellite observations from OCI-PACE
    ...                                ...
    identifier_product_doi:            10.5067/PACE/OCI/L3M/IOP/3.0
    keywords:                          Earth Science > Oceans > Ocean Optics ...
    keywords_vocabulary:               NASA Global Change Master Directory (G...
    data_bins:                         Attribute elided: Unsupported attribut...
    data_minimum:                      -0.776600242
data_maximum: 5.00000238 Dimensions: wavelength : 19lat : 4320lon : 8640rgb : 3eightbitcolor : 256
Coordinates: (3)
wavelength
(wavelength)
float64
351.0 361.0 385.0 ... 678.0 711.0
long_name : wavelengths units : nm valid_min : 0 valid_max : 20000 array([351., 361., 385., 413., 425., 442., 460., 475., 490., 510., 532., 555.,
583., 618., 640., 655., 665., 678., 711.]) lat
(lat)
float32
89.98 89.94 89.9 ... -89.94 -89.98
long_name : Latitude units : degrees_north standard_name : latitude valid_min : -90.0 valid_max : 90.0 array([ 89.979164, 89.9375 , 89.895836, ..., -89.895836, -89.93751 ,
-89.97917 ], dtype=float32) lon
(lon)
float32
-180.0 -179.9 ... 179.9 180.0
long_name : Longitude units : degrees_east standard_name : longitude valid_min : -180.0 valid_max : 180.0 array([-179.97917, -179.9375 , -179.89583, ..., 179.89584, 179.93752,
179.97917], dtype=float32) Data variables: (2)
Indexes: (3)
PandasIndex
PandasIndex(Index([351.0, 361.0, 385.0, 413.0, 425.0, 442.0, 460.0, 475.0, 490.0, 510.0,
       532.0, 555.0, 583.0, 618.0, 640.0, 655.0, 665.0, 678.0, 711.0],
dtype='float64', name='wavelength')) PandasIndex
PandasIndex(Index([ 89.97916412353516,            89.9375,  89.89583587646484,
        89.85416412353516,            89.8125,  89.77083587646484,
        89.72916412353516,            89.6875,  89.64583587646484,
        89.60416412353516,
       ...
       -89.60417175292969, -89.64583587646484, -89.68750762939453,
       -89.72917175292969, -89.77083587646484, -89.81250762939453,
       -89.85417175292969, -89.89583587646484, -89.93750762939453,
       -89.97917175292969],
dtype='float32', name='lat', length=4320)) PandasIndex
PandasIndex(Index([-179.9791717529297,          -179.9375, -179.8958282470703,
       -179.8541717529297,          -179.8125, -179.7708282470703,
       -179.7291717529297,          -179.6875, -179.6458282470703,
       -179.6041717529297,
       ...
        179.6041717529297, 179.64584350585938, 179.68751525878906,
        179.7291717529297, 179.77084350585938, 179.81251525878906,
        179.8541717529297, 179.89584350585938, 179.93751525878906,
        179.9791717529297],
      dtype='float32', name='lon', length=8640))
Attributes: (64)
product_name : PACE_OCI.20240801.L3m.DAY.IOP.V3_0.aph.4km.nc instrument : OCI title : OCI Level-3 Standard Mapped Image project : Ocean Biology Processing Group (NASA/GSFC/OBPG) platform : PACE source : satellite observations from OCI-PACE temporal_range : day processing_version : 3.0 date_created : 2025-02-14T04:41:09.000Z history : l3mapgen par=PACE_OCI.20240801.L3m.DAY.IOP.V3_0.aph.4km.nc.param l2_flag_names : ATMFAIL,LAND,HILT,HISATZEN,STRAYLIGHT,CLDICE,COCCOLITH,LOWLW,CHLWARN,CHLFAIL,NAVWARN,MAXAERITER,HISOLZEN,NAVFAIL,FILTER,HIGLINT time_coverage_start : 2024-07-31T23:46:25.000Z time_coverage_end : 2024-08-02T01:44:15.000Z start_orbit_number : 0 end_orbit_number : 0 map_projection : Equidistant Cylindrical latitude_units : degrees_north longitude_units : degrees_east northernmost_latitude : 90.0 southernmost_latitude : -90.0 westernmost_longitude : -180.0 easternmost_longitude : 180.0 geospatial_lat_max : 90.0 geospatial_lat_min : -90.0 geospatial_lon_max : 180.0 geospatial_lon_min : -180.0 latitude_step : 0.0416666679 longitude_step : 0.0416666679 sw_point_latitude : -89.9791641 sw_point_longitude : -179.979172 spatialResolution : 4.638312 km geospatial_lon_resolution : 4.638312 km geospatial_lat_resolution : 4.638312 km geospatial_lat_units : degrees_north geospatial_lon_units : degrees_east number_of_lines : 4320 number_of_columns : 8640 measure : Mean suggested_image_scaling_minimum : 0.00100000005 suggested_image_scaling_maximum : 1.0 suggested_image_scaling_type : LOG suggested_image_scaling_applied : No _lastModified : 2025-02-14T04:41:09.000Z Conventions : CF-1.6 ACDD-1.3 institution : NASA Goddard Space Flight Center, Ocean Ecology Laboratory, Ocean Biology Processing Group standard_name_vocabulary : CF Standard Name Table v36 naming_authority : gov.nasa.gsfc.sci.oceandata id : 3.0/L3/PACE_OCI.20240801.L3b.DAY.IOP.V3_0.nc license : https://science.nasa.gov/earth-science/earth-science-data/data-information-policy/ creator_name : NASA/GSFC/OBPG publisher_name : NASA/GSFC/OBPG creator_email : data@oceancolor.gsfc.nasa.gov publisher_email : data@oceancolor.gsfc.nasa.gov creator_url : https://oceandata.sci.gsfc.nasa.gov publisher_url : https://oceandata.sci.gsfc.nasa.gov processing_level : L3 Mapped cdm_data_type : grid identifier_product_doi_authority : http://dx.doi.org identifier_product_doi : 10.5067/PACE/OCI/L3M/IOP/3.0 keywords : Earth Science > Oceans > Ocean Optics > Reflectance keywords_vocabulary : NASA Global Change Master Directory (GCMD) Science Keywords data_bins : Attribute elided: Unsupported attribute type (NC_INT64) data_minimum : -0.776600242 data_maximum : 5.00000238
%% time= ds['aph' ].sel(lat= 44.6517 , lon=- 124.1770 , method= 'nearest' )
CPU times: user 1.51 ms, sys: 0 ns, total: 1.51 ms
Wall time: 1.47 ms
array(-124.1875, dtype=float32)
Multiple days
I could not get this to work.
= [f"http://oceandata.sci.gsfc.nasa.gov/opendap/PACE_OCI/L3SMI/2024/08 { day:02d} /PACE_OCI.202408 { day:02d} .L3m.DAY.IOP.V3_0.aph.4km.nc" for day in range (1 , 7 )= xr.open_mfdataset(= "pydap" ,= 'nested' , concat_dim= "time" , = edl_session)
<xarray.Dataset> Size: 34GB
Dimensions:     (time: 6, lat: 4320, lon: 8640, wavelength: 19, rgb: 3,
                 eightbitcolor: 256)
Coordinates:
  * wavelength  (wavelength) float64 152B 351.0 361.0 385.0 ... 678.0 711.0
  * lat         (lat) float32 17kB 89.98 89.94 89.9 ... -89.9 -89.94 -89.98
  * lon         (lon) float32 35kB -180.0 -179.9 -179.9 ... 179.9 179.9 180.0
Dimensions without coordinates: time, rgb, eightbitcolor
Data variables:
    aph         (time, lat, lon, wavelength) float64 34GB dask.array<chunksize=(1, 4320, 8640, 19), meta=np.ndarray>
    palette     (time, rgb, eightbitcolor) uint8 5kB dask.array<chunksize=(1, 3, 256), meta=np.ndarray>
Attributes: (12/64)
    product_name:                      PACE_OCI.20240801.L3m.DAY.IOP.V3_0.aph...
    instrument:                        OCI
    title:                             OCI Level-3 Standard Mapped Image
    project:                           Ocean Biology Processing Group (NASA/G...
    platform:                          PACE
    source:                            satellite observations from OCI-PACE
    ...                                ...
    identifier_product_doi:            10.5067/PACE/OCI/L3M/IOP/3.0
    keywords:                          Earth Science > Oceans > Ocean Optics ...
    keywords_vocabulary:               NASA Global Change Master Directory (G...
    data_bins:                         Attribute elided: Unsupported attribut...
    data_minimum:                      -0.776600242
data_maximum: 5.00000238 Dimensions: time : 6lat : 4320lon : 8640wavelength : 19rgb : 3eightbitcolor : 256
Coordinates: (3)
wavelength
(wavelength)
float64
351.0 361.0 385.0 ... 678.0 711.0
long_name : wavelengths units : nm valid_min : 0 valid_max : 20000 array([351., 361., 385., 413., 425., 442., 460., 475., 490., 510., 532., 555.,
583., 618., 640., 655., 665., 678., 711.]) lat
(lat)
float32
89.98 89.94 89.9 ... -89.94 -89.98
long_name : Latitude units : degrees_north standard_name : latitude valid_min : -90.0 valid_max : 90.0 array([ 89.979164, 89.9375 , 89.895836, ..., -89.895836, -89.93751 ,
-89.97917 ], dtype=float32) lon
(lon)
float32
-180.0 -179.9 ... 179.9 180.0
long_name : Longitude units : degrees_east standard_name : longitude valid_min : -180.0 valid_max : 180.0 array([-179.97917, -179.9375 , -179.89583, ..., 179.89584, 179.93752,
179.97917], dtype=float32) Data variables: (2)
aph
(time, lat, lon, wavelength)
float64
dask.array<chunksize=(1, 4320, 8640, 19), meta=np.ndarray>
long_name : Absorption due to phytoplankton units : m^-1 valid_min : -24998 valid_max : 25000 reference : P.J. Werdell, B.A. Franz, S.W. Bailey, G.C. Feldman and 15 co-authors, Generalized ocean color inversion model for retrieving marine inherent optical properties, Applied Optics 52, 2019-2037 (2013). display_scale : log display_min : 0.00100000005 display_max : 1.0
Bytes
31.70 GiB
5.28 GiB
Shape
(6, 4320, 8640, 19)
(1, 4320, 8640, 19)
Dask graph
6 chunks in 19 graph layers
Data type
float64 numpy.ndarray
6 1 19 8640 4320
palette
(time, rgb, eightbitcolor)
uint8
dask.array<chunksize=(1, 3, 256), meta=np.ndarray>
Bytes
4.50 kiB
768 B
Shape
(6, 3, 256)
(1, 3, 256)
Dask graph
6 chunks in 19 graph layers
Data type
uint8 numpy.ndarray
256 3 6
Indexes: (3)
PandasIndex
PandasIndex(Index([351.0, 361.0, 385.0, 413.0, 425.0, 442.0, 460.0, 475.0, 490.0, 510.0,
       532.0, 555.0, 583.0, 618.0, 640.0, 655.0, 665.0, 678.0, 711.0],
dtype='float64', name='wavelength')) PandasIndex
PandasIndex(Index([ 89.97916412353516,            89.9375,  89.89583587646484,
        89.85416412353516,            89.8125,  89.77083587646484,
        89.72916412353516,            89.6875,  89.64583587646484,
        89.60416412353516,
       ...
       -89.60417175292969, -89.64583587646484, -89.68750762939453,
       -89.72917175292969, -89.77083587646484, -89.81250762939453,
       -89.85417175292969, -89.89583587646484, -89.93750762939453,
       -89.97917175292969],
dtype='float32', name='lat', length=4320)) PandasIndex
PandasIndex(Index([-179.9791717529297,          -179.9375, -179.8958282470703,
       -179.8541717529297,          -179.8125, -179.7708282470703,
       -179.7291717529297,          -179.6875, -179.6458282470703,
       -179.6041717529297,
       ...
        179.6041717529297, 179.64584350585938, 179.68751525878906,
        179.7291717529297, 179.77084350585938, 179.81251525878906,
        179.8541717529297, 179.89584350585938, 179.93751525878906,
        179.9791717529297],
      dtype='float32', name='lon', length=8640))
Attributes: (64)
product_name : PACE_OCI.20240801.L3m.DAY.IOP.V3_0.aph.4km.nc instrument : OCI title : OCI Level-3 Standard Mapped Image project : Ocean Biology Processing Group (NASA/GSFC/OBPG) platform : PACE source : satellite observations from OCI-PACE temporal_range : day processing_version : 3.0 date_created : 2025-02-14T04:41:09.000Z history : l3mapgen par=PACE_OCI.20240801.L3m.DAY.IOP.V3_0.aph.4km.nc.param l2_flag_names : ATMFAIL,LAND,HILT,HISATZEN,STRAYLIGHT,CLDICE,COCCOLITH,LOWLW,CHLWARN,CHLFAIL,NAVWARN,MAXAERITER,HISOLZEN,NAVFAIL,FILTER,HIGLINT time_coverage_start : 2024-07-31T23:46:25.000Z time_coverage_end : 2024-08-02T01:44:15.000Z start_orbit_number : 0 end_orbit_number : 0 map_projection : Equidistant Cylindrical latitude_units : degrees_north longitude_units : degrees_east northernmost_latitude : 90.0 southernmost_latitude : -90.0 westernmost_longitude : -180.0 easternmost_longitude : 180.0 geospatial_lat_max : 90.0 geospatial_lat_min : -90.0 geospatial_lon_max : 180.0 geospatial_lon_min : -180.0 latitude_step : 0.0416666679 longitude_step : 0.0416666679 sw_point_latitude : -89.9791641 sw_point_longitude : -179.979172 spatialResolution : 4.638312 km geospatial_lon_resolution : 4.638312 km geospatial_lat_resolution : 4.638312 km geospatial_lat_units : degrees_north geospatial_lon_units : degrees_east number_of_lines : 4320 number_of_columns : 8640 measure : Mean suggested_image_scaling_minimum : 0.00100000005 suggested_image_scaling_maximum : 1.0 suggested_image_scaling_type : LOG suggested_image_scaling_applied : No _lastModified : 2025-02-14T04:41:09.000Z Conventions : CF-1.6 ACDD-1.3 institution : NASA Goddard Space Flight Center, Ocean Ecology Laboratory, Ocean Biology Processing Group standard_name_vocabulary : CF Standard Name Table v36 naming_authority : gov.nasa.gsfc.sci.oceandata id : 3.0/L3/PACE_OCI.20240801.L3b.DAY.IOP.V3_0.nc license : https://science.nasa.gov/earth-science/earth-science-data/data-information-policy/ creator_name : NASA/GSFC/OBPG publisher_name : NASA/GSFC/OBPG creator_email : data@oceancolor.gsfc.nasa.gov publisher_email : data@oceancolor.gsfc.nasa.gov creator_url : https://oceandata.sci.gsfc.nasa.gov publisher_url : https://oceandata.sci.gsfc.nasa.gov processing_level : L3 Mapped cdm_data_type : grid identifier_product_doi_authority : http://dx.doi.org identifier_product_doi : 10.5067/PACE/OCI/L3M/IOP/3.0 keywords : Earth Science > Oceans > Ocean Optics > Reflectance keywords_vocabulary : NASA Global Change Master Directory (GCMD) Science Keywords data_bins : Attribute elided: Unsupported attribute type (NC_INT64) data_minimum : -0.776600242 data_maximum : 5.00000238
# Cannot get this data to load = ds['aph' ].sel(lat= 44.6517 , lon=- 124.1770 , method= 'nearest' )
<xarray.DataArray 'aph' (time: 2, wavelength: 19)> Size: 304B
dask.array<getitem, shape=(2, 19), dtype=float64, chunksize=(1, 19), chunktype=numpy.ndarray>
Coordinates:
  * wavelength  (wavelength) float64 152B 351.0 361.0 385.0 ... 678.0 711.0
    lat         float32 4B 44.65
    lon         float32 4B -124.2
Dimensions without coordinates: time
Attributes:
    long_name:      Absorption due to phytoplankton
    units:          m^-1
    valid_min:      -24998
    valid_max:      25000
    reference:      P.J. Werdell, B.A. Franz, S.W. Bailey, G.C. Feldman and 1...
    display_scale:  log
    display_min:    0.00100000005
display_max: 1.0 Coordinates: (3)
Indexes: (1)
PandasIndex
PandasIndex(Index([351.0, 361.0, 385.0, 413.0, 425.0, 442.0, 460.0, 475.0, 490.0, 510.0,
       532.0, 555.0, 583.0, 618.0, 640.0, 655.0, 665.0, 678.0, 711.0],
      dtype='float64', name='wavelength'))
Attributes: (8)
long_name : Absorption due to phytoplankton units : m^-1 valid_min : -24998 valid_max : 25000 reference : P.J. Werdell, B.A. Franz, S.W. Bailey, G.C. Feldman and 15 co-authors, Generalized ocean color inversion model for retrieving marine inherent optical properties, Applied Optics 52, 2019-2037 (2013). display_scale : log display_min : 0.00100000005 display_max : 1.0
# this doesn't work
#ds_np.values
Chlorophyl
http://oceandata.sci.gsfc.nasa.gov/opendap/PACE_OCI/L3SMI/2024/0801/PACE_OCI.20240801.L3m.DAY.CHL.V3_0.chlor_a.4km.nc
import warnings"ignore" ,= "PyDAP was unable to determine the DAP protocol defaulting to DAP2.*" ,= UserWarning ,= "pydap.handlers.dap" import earthaccess= True )= earthaccess.get_requests_https_session()import xarray as xr= "http://oceandata.sci.gsfc.nasa.gov/opendap/PACE_OCI/L3SMI/2024/0801/PACE_OCI.20240801.L3m.DAY.CHL.V3_0.chlor_a.4km.nc" = xr.open_dataset(url, engine= "pydap" , session= edl_session)
<xarray.Dataset> Size: 149MB
Dimensions:  (lat: 4320, lon: 8640, rgb: 3, eightbitcolor: 256)
Coordinates:
  * lat      (lat) float32 17kB 89.98 89.94 89.9 89.85 ... -89.9 -89.94 -89.98
  * lon      (lon) float32 35kB -180.0 -179.9 -179.9 ... 179.9 179.9 180.0
Dimensions without coordinates: rgb, eightbitcolor
Data variables:
    chlor_a  (lat, lon) float32 149MB ...
    palette  (rgb, eightbitcolor) uint8 768B ...
Attributes: (12/64)
    product_name:                      PACE_OCI.20240801.L3m.DAY.CHL.V3_0.chl...
    instrument:                        OCI
    title:                             OCI Level-3 Standard Mapped Image
    project:                           Ocean Biology Processing Group (NASA/G...
    platform:                          PACE
    source:                            satellite observations from OCI-PACE
    ...                                ...
    identifier_product_doi:            10.5067/PACE/OCI/L3M/CHL/3.0
    keywords:                          Earth Science > Oceans > Ocean Chemist...
    keywords_vocabulary:               NASA Global Change Master Directory (G...
    data_bins:                         Attribute elided: Unsupported attribut...
    data_minimum:                      0.00122490886
data_maximum: 99.777832 Dimensions: lat : 4320lon : 8640rgb : 3eightbitcolor : 256
Coordinates: (2)
Data variables: (2)
chlor_a
(lat, lon)
float32
...
long_name : Chlorophyll Concentration, OCI Algorithm units : mg m^-3 standard_name : mass_concentration_of_chlorophyll_in_sea_water valid_min : 0.00100000005 valid_max : 100.0 reference : Hu, C., Lee Z., and Franz, B.A. (2012). Chlorophyll-a algorithms for oligotrophic oceans: A novel approach based on three-band reflectance difference, J. Geophys. Res., 117, C01011, doi:10.1029/2011JC007395. display_scale : log display_min : 0.00999999978 display_max : 20.0 [37324800 values with dtype=float32] palette
(rgb, eightbitcolor)
uint8
...
[768 values with dtype=uint8] Indexes: (2)
PandasIndex
PandasIndex(Index([ 89.97916412353516,            89.9375,  89.89583587646484,
        89.85416412353516,            89.8125,  89.77083587646484,
        89.72916412353516,            89.6875,  89.64583587646484,
        89.60416412353516,
       ...
       -89.60417175292969, -89.64583587646484, -89.68750762939453,
       -89.72917175292969, -89.77083587646484, -89.81250762939453,
       -89.85417175292969, -89.89583587646484, -89.93750762939453,
       -89.97917175292969],
dtype='float32', name='lat', length=4320)) PandasIndex
PandasIndex(Index([-179.9791717529297,          -179.9375, -179.8958282470703,
       -179.8541717529297,          -179.8125, -179.7708282470703,
       -179.7291717529297,          -179.6875, -179.6458282470703,
       -179.6041717529297,
       ...
        179.6041717529297, 179.64584350585938, 179.68751525878906,
        179.7291717529297, 179.77084350585938, 179.81251525878906,
        179.8541717529297, 179.89584350585938, 179.93751525878906,
        179.9791717529297],
      dtype='float32', name='lon', length=8640))
Attributes: (64)
product_name : PACE_OCI.20240801.L3m.DAY.CHL.V3_0.chlor_a.4km.nc instrument : OCI title : OCI Level-3 Standard Mapped Image project : Ocean Biology Processing Group (NASA/GSFC/OBPG) platform : PACE source : satellite observations from OCI-PACE temporal_range : day processing_version : 3.0 date_created : 2025-02-14T03:41:14.000Z history : l3mapgen par=PACE_OCI.20240801.L3m.DAY.CHL.V3_0.chlor_a.4km.nc.param l2_flag_names : ATMFAIL,LAND,HILT,HISATZEN,STRAYLIGHT,CLDICE,COCCOLITH,LOWLW,CHLWARN,CHLFAIL,NAVWARN,MAXAERITER,HISOLZEN,NAVFAIL,FILTER,HIGLINT time_coverage_start : 2024-07-31T23:46:25.000Z time_coverage_end : 2024-08-02T01:44:15.000Z start_orbit_number : 0 end_orbit_number : 0 map_projection : Equidistant Cylindrical latitude_units : degrees_north longitude_units : degrees_east northernmost_latitude : 90.0 southernmost_latitude : -90.0 westernmost_longitude : -180.0 easternmost_longitude : 180.0 geospatial_lat_max : 90.0 geospatial_lat_min : -90.0 geospatial_lon_max : 180.0 geospatial_lon_min : -180.0 latitude_step : 0.0416666679 longitude_step : 0.0416666679 sw_point_latitude : -89.9791641 sw_point_longitude : -179.979172 spatialResolution : 4.638312 km geospatial_lon_resolution : 4.638312 km geospatial_lat_resolution : 4.638312 km geospatial_lat_units : degrees_north geospatial_lon_units : degrees_east number_of_lines : 4320 number_of_columns : 8640 measure : Mean suggested_image_scaling_minimum : 0.00999999978 suggested_image_scaling_maximum : 20.0 suggested_image_scaling_type : LOG suggested_image_scaling_applied : No _lastModified : 2025-02-14T03:41:14.000Z Conventions : CF-1.6 ACDD-1.3 institution : NASA Goddard Space Flight Center, Ocean Ecology Laboratory, Ocean Biology Processing Group standard_name_vocabulary : CF Standard Name Table v36 naming_authority : gov.nasa.gsfc.sci.oceandata id : 3.0/L3/PACE_OCI.20240801.L3b.DAY.CHL.V3_0.nc license : https://science.nasa.gov/earth-science/earth-science-data/data-information-policy/ creator_name : NASA/GSFC/OBPG publisher_name : NASA/GSFC/OBPG creator_email : data@oceancolor.gsfc.nasa.gov publisher_email : data@oceancolor.gsfc.nasa.gov creator_url : https://oceandata.sci.gsfc.nasa.gov publisher_url : https://oceandata.sci.gsfc.nasa.gov processing_level : L3 Mapped cdm_data_type : grid identifier_product_doi_authority : http://dx.doi.org identifier_product_doi : 10.5067/PACE/OCI/L3M/CHL/3.0 keywords : Earth Science > Oceans > Ocean Chemistry > Pigments > Chlorophyll; Earth Science > Oceans > Ocean Chemistry > Chlorophyll keywords_vocabulary : NASA Global Change Master Directory (GCMD) Science Keywords data_bins : Attribute elided: Unsupported attribute type (NC_INT64) data_minimum : 0.00122490886 data_maximum : 99.777832
print (f"Dataset size: { ds. nbytes/ 1e6 :.2f} MB" )
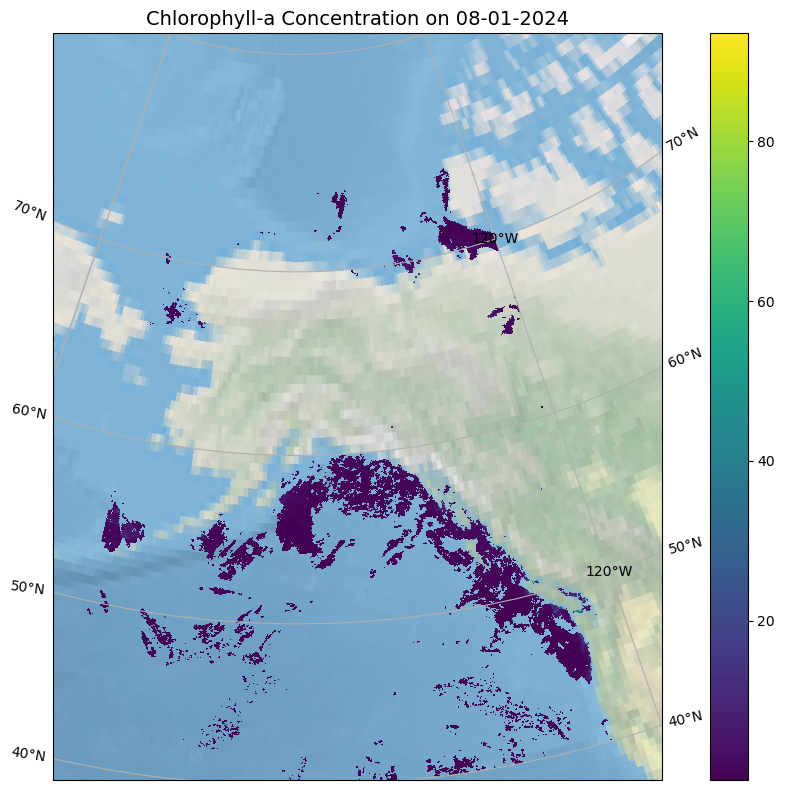
Make a pretty plot
Why so much blank spaces? Clouds. This is not a gap-filled product.
import xarray as xrimport matplotlib.pyplot as pltimport cartopy.crs as ccrsimport cartopy.feature as cfeature# Select your region of interest = ds["chlor_a" ].sel(lat= slice (80 , 40 ), lon= slice (- 170 , - 120 ))# Set up the plot with Lambert Conformal projection = (10 , 8 ))= plt.axes(projection= ccrs.LambertConformal(central_longitude=- 150 ))- 170 , - 120 , 40 , 80 ], crs= ccrs.PlateCarree())# Optional: Add map background features # Basic Earth background #ax.coastlines(resolution='10m') # Detailed coastlines if available #ax.add_feature(cfeature.BORDERS, linestyle=':') = True )# Plot the chlorophyll-a data = ax,= ccrs.PlateCarree(), # Data is in lat/lon coords = 'lon' ,= 'lat' ,= 'viridis' ,= True ,= False "Chlorophyll-a Concentration on 08-01-2024" , fontsize= 14 )
Conclusion
Working with NASA OPeNDAP servers using the earthaccess authenticated sessions, makes it easier to using xarray for single and multiple files.