import matplotlib.pyplot as plt

x = [5,7,8,7,2,17,2,9,4,11,12,9,6]
y = [99,86,87,88,111,86,103,87,94,78,77,85,86]

plt.scatter(x, y)
plt.show()
You can have code Python in your qmd file. You will need to have these installed on your local computer, but presumably you do already if you are adding code to your qmd files.
import matplotlib.pyplot as plt
x = [5,7,8,7,2,17,2,9,4,11,12,9,6]
y = [99,86,87,88,111,86,103,87,94,78,77,85,86]
plt.scatter(x, y)
plt.show()
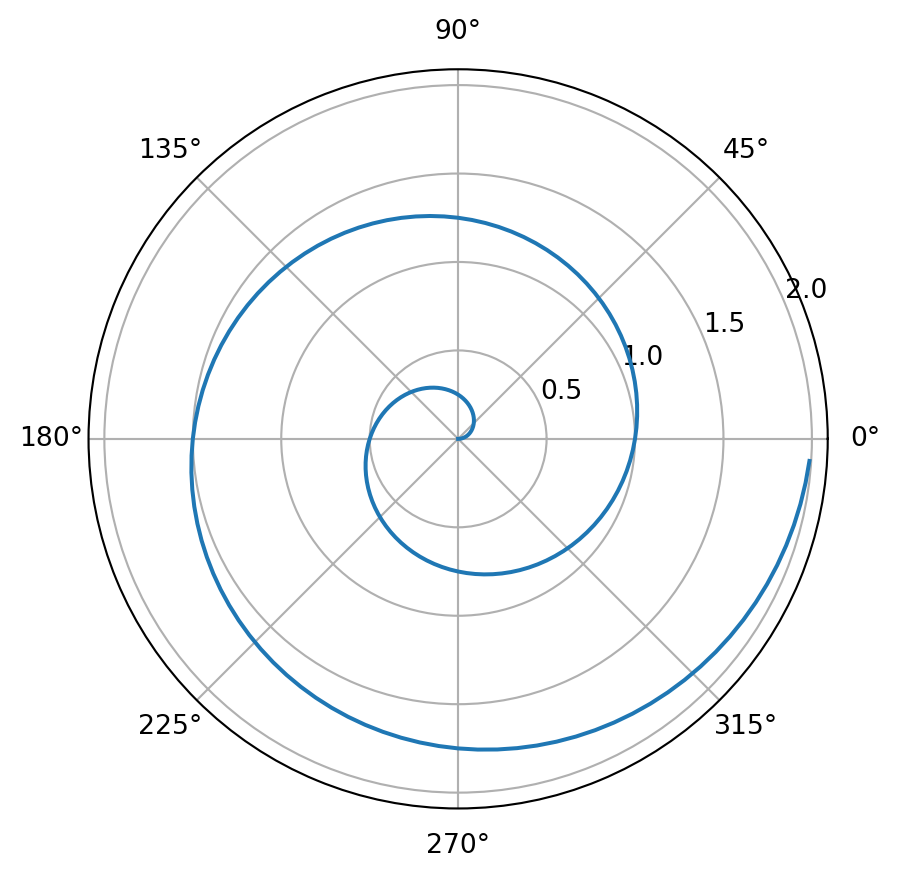
For a demonstration of a line plot on a polar axis, see Figure 1.
import numpy as np
import matplotlib.pyplot as plt
r = np.arange(0, 2, 0.01)
theta = 2 * np.pi * r
fig, ax = plt.subplots(subplot_kw={'projection': 'polar'})
ax.plot(theta, r)
ax.set_rticks([0.5, 1, 1.5, 2])
ax.grid(True)
plt.show()
When you add Python modules, you will need to change the GitHub Action in .github/workflows to install these in order for GitHub to be able to render your webpage. The GitHub Action installs Python since I used that in code.qmd. If you use R or Julia instead, then you will need to update the GitHub Action to install those.
If getting the GitHub Action to work is too much hassle (and that definitely happens), you can alway render locally and publish to the gh-pages branch. If you do this, make sure to delete or rename the GitHub Action to something like
render-and-publish.old_ymlso GitHub does not keep trying to run it. Nothing bad will happen if you don’t do this, but if you are not using the action (because it keeps failing), then you don’t need GitHub to run it.
To render locally and push up to the gh-pages branch, open a terminal window and then cd to the directory with the Quarto project. Type this in the terminal:
quarto render gh-pages